
Sharing thoughts on being a maker and sometime breaker of tech along with other interests such as electronics, photography, films and running.
Opinions are my own...unless pilfered from someone smarter, better looking or can do more push-ups.
Enabling Diagnostics and Logging output from Windows Azure Web Apps
Peering inside software while running locally in our dev environment is a no-brainer. We have heaps of tools that can help. Post-deployent, however, our diminished visibility makes it a bit harder to look into the inner-workings of that distant production server and the code we've unleashed on it.
I recently noticed an issue in a web app running in production in the Windows Azure Web App platform that hadn’t been occurring while running on my own box. I ran some tests locally and realised that it was a environmental issue that I couldn’t directly reproduce or debug locally. The application wasn’t doing anything too complicated. It hit an end-point that updated the database, then redirected to a resulting page. I had plenty of logging statements within my code, but without the configuration allowing them to be output anywhere, they were useless to me.
The Web App platform on Windows Azure offers a number of ways to manage logging and related diagnostics of web apps. Some approaches are designed as an on-going logging solution, to be set up and to continue outputting and writing log entries permanently, while others are designed to help trouble-shoot issues like I’d experienced.
I’m going to describe some of the logging options to assist in these trouble-shooting scenarios and follow a few steps to set this up. In brief, the steps I’ll cover here are:
- Set up the web app and configure it to log custom application message to the local file system
- Configure the logging level so I’m capturing the appropriate log entries
- View the log entries by both downloading the log files in their entirity and streaming them live from the server
##The web app
For this demonstration, I’ve set up a simple Mvc application with one Controller and Action to generate log messages. The source code for the project can be found on GitHub at https://github.com/medleykupps/AzureLoggingWebsite.
As you can see, the Homepage action generates a WriteLine message, followed by an Information, a Warning, then an Error level log message.
public class HomeController : Controller
{
public ActionResult Homepage()
{
Trace.WriteLine( "Entering Homepage action");
// Output an Information level message
Trace.TraceInformation( "Generate Information trace at {0}" , DateTime.Now);
// Output a Warning level message
Trace.TraceWarning( "Generate Warning trace at {0}" , DateTime .Now);
// Output an Error level message
Trace.TraceError( "Generate Error trace at {0}", DateTime .Now);
return View();
}
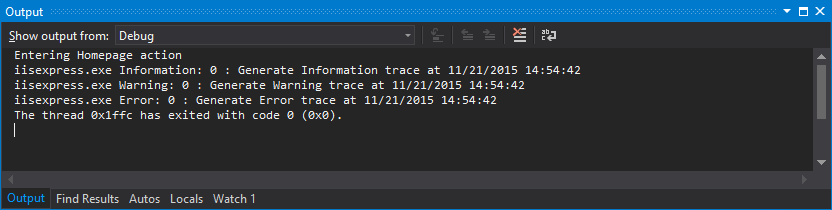
}By debugging the application in Visual Studio and watching the Debug Output, we can verify that the log messages are being generated. Visual Studio doesn’t filter any of the messages when outputting them. Even the Trace.WriteLine command gets output which is skipped by most other logging situations as we’ll see later.
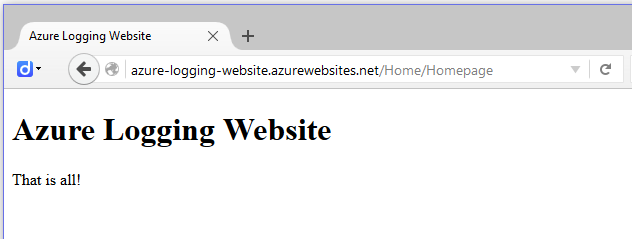
So, happy with those results, we deploy to the Azure web app running in the cloud, and I can successfully hit the web page.
Configure Logging in the Azure Portal
From the web app’s configuration in the new Azure Portal, we can browse to the Diagnostics logs slide-out under Settings.
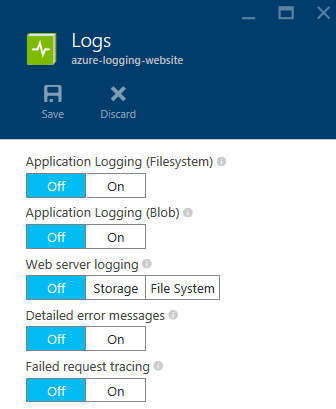
We’re able to see the full range of logging options. These are the configuration options for both the temporary, trouble-shooting technique I’m describing here along with the permanent logging scenario where we persist the logs to a Storage Account. The option I’m interested in is Application Logging (Filesystem). Enabling this and setting a Level such as Warning will cause all custom logging messages your web app generates to be output to the LogFiles/application folder on the file system.
Briefly, the other options that are available here are:
Application Logging (Blob)
Selecting a Log Level and the relevant destination container from a Storage Account will begin persisting log files into blob storage. This is a great on-going logging solution.
Web server logging
This outputs trace messages from the web server to either the file system or to blob storage. The raw data is available for download but probably better viewed in a more elegant log viewer tool than something like notepad. The trace files are available at LogFiles/http/RawLogs/.
Detailed error messages
This causes a lot more details to be dumped either to the file system at /Log Files/DetailedErrors/ or to blob storage. Each failed request is its own html file with details of the error. This is not intended to be run for too long on the server.
Failed request tracing
Similar to the Detailed error messages option, this dumps a lot of request information to either the file system or to blob storage. These detailed messages contain information about each handler that processes the request along its path and where errors were raised. Once again, this is only intended to be run while diagnosing production server issues…not to be run during normal operation.
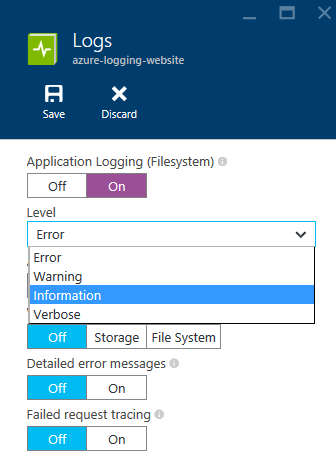
We enable Application logging (Filesystem) and select Information as the Level.
Viewing log entries
From this point on, any request hitting our web app will cause the application to generate log entries that are saved to the local file system.
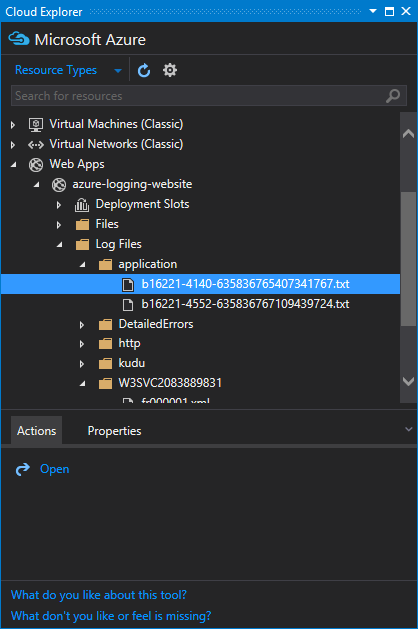
We’re able to browse to these log files a few different ways. One approach is to ftp to the server and download the files. Yet another approach is to browse to the server via the Cloud Explorer window in Visual Studio.
Streaming the logs in Visual Studio
When trouble-shooting issues with the remote web app, a good method for keeping an eye on the logs as they happen is to stream the log entries from within Visual Studio.
Browse via the Cloud Explorer and select View Streaming Logs.
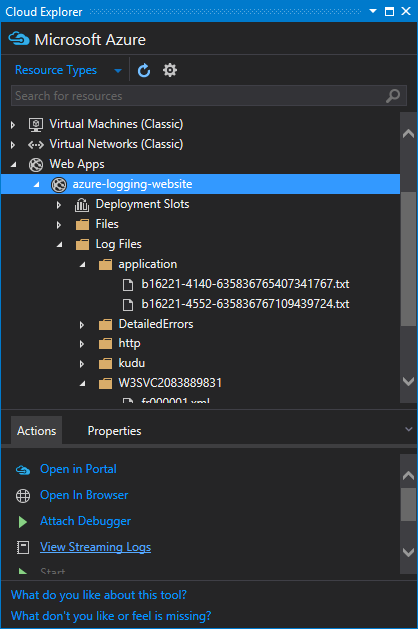
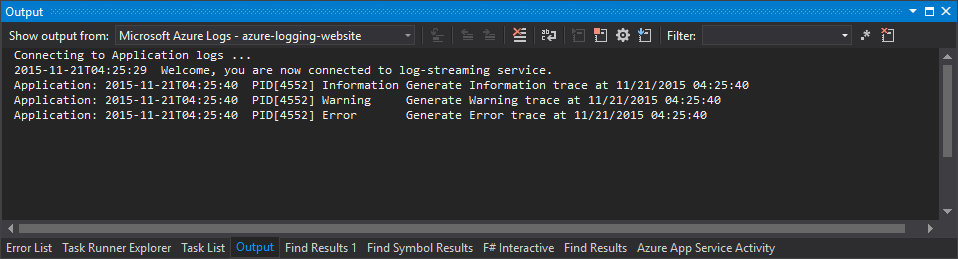
This results in the application logs being output into the Debug Output window.
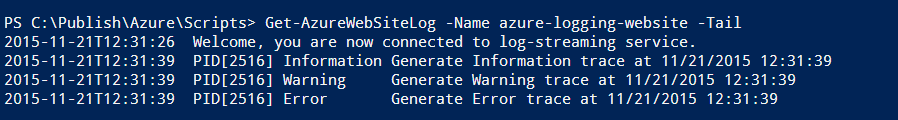
Streaming to the Powershell Command Line
If Visual Studio is unavailable but Powershell is, the logs can also be streamed to the command line. Running Get-AzureWebSiteLog -Name azure-logging-website -Tail causes each log to be output as it occurs.
Conclusion
There are a number of ways to peer inside a remote web app in Azure. Live streaming to Visual Studio or to the command line are very handy. Downloading the log files and interrogating in a log viewer application can equally be quite handy. From a development perspective, knowing the methods for configuring logging on the Azure platform is quite important when needing to see what’s happening with your app, but also having a good strategy for logging within your application opens up the door for you and helps you in those moments when your production app has gone awry. More on this topic later.
Download the very simple Mvc app I used to demo this from GitHub at https://github.com/medleykupps/AzureLoggingWebsite.